Sector-Wise Consumption of Electricity in India
2019-01-26
Visualize the amount of electricity consumed by various sectors in India.
Usage
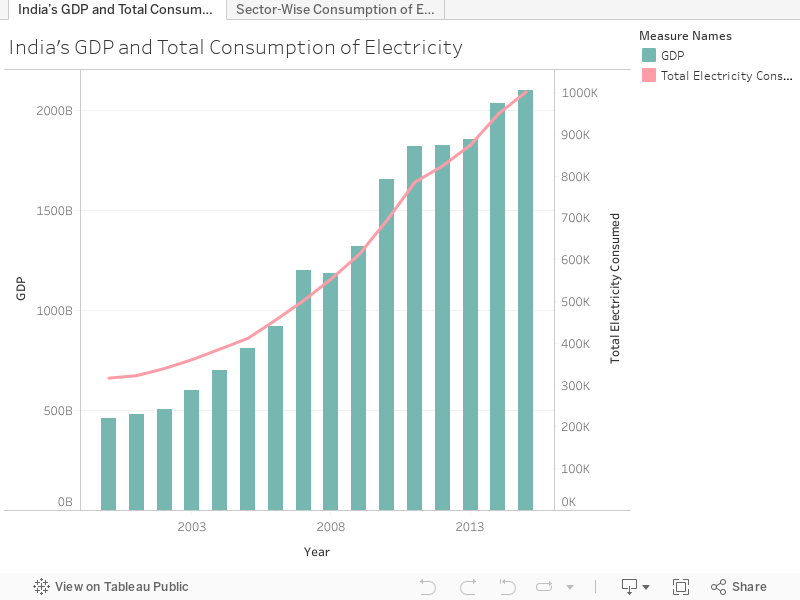
Line and Bar Chart #1
- Shows the progression in consumption of electricity and value of India’s GDP over time.
- The bars represent GDP, while the line represents the total consumption of electricity.
Continuous Line Chart #1
- Shows the changes in consumption of electricity over time.
- Sectors differentiated by colour.
Data Source #1 | Data Source #2