Non-Agricultural Foodstuff Production in India
2019-01-26
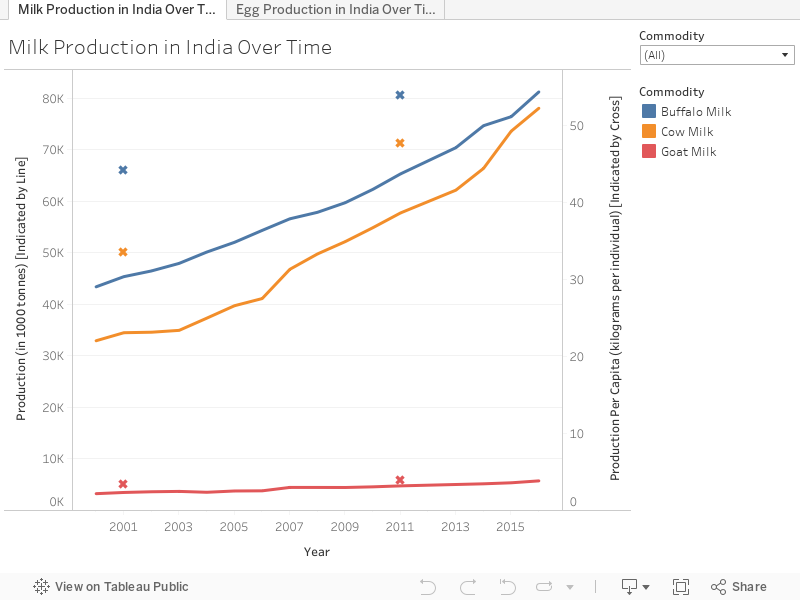
Visualize the changes in production quantities of various non-agricultural products in India over time. This is a member of a two-part visualization. Here’s the first part, covering agricultural foodstuff production.
Usage
Both Continuous Line Charts
- Line shows the changes in production quantity of commodity over time. Reference axis on the left.
- Crosses show the production per capita for that year. Reference axis on the right.
- Use sidebar tools to filter and search for certain commodities.
Notes
- Production per capita data is available only for years in which a census survey of India was conducted, i.e. 1961, 1971, 1981, 1991, 2001, 2011.
- Population data was gathered from the Censuses of India for the aforementioned years. No interpolation techniques were used, unless specified by the counting agency.
Data Source #1 | Data Source #2 | Data Source #3