Retail Prices of Commodities in India
2019-01-03
Visualize the changes in retail prices of essential commodities sold in locations across India.
Fun Fact: This visualisation uses 2,527,015 rows of data to compute the results you see below.
Interesting Insights
- The price of potatoes and onions peaks during the October–January period in most locations.
- The price of tomatoes, on an average, peaks every August in most locations.
Usage
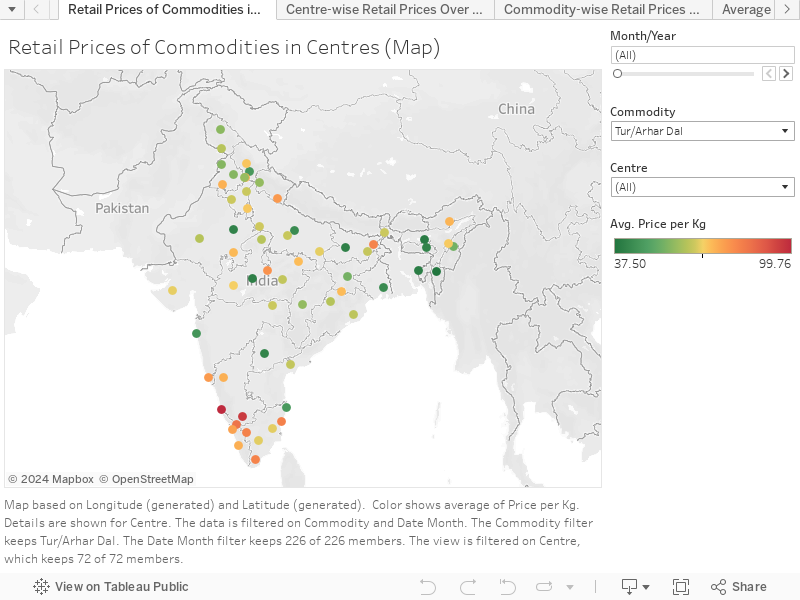
Map
- Plots location where price was measured on a map.
- Each point is coloured with reference to a scale on the basis of the average price of the selected commodity for that month.
- Hover over point to view details regarding average price for that month.
- Use sidebar tools to filter and search for certain commodities or locations.
Continuous Line Chart #1
- Displays trend of average price per month for a single location.
- Commodities are differentiated by colour.
- Use sidebar tools to filter and search for certain commodities or locations.
Continuous Line Chart #2
- Displays trend of average price per month for a single commodity.
- Locations are differentiated by colour.
- Use sidebar tools to filter and search for certain commodities or locations.
Bar Chart #1
- Displays the average price in a month (averaged across years) for commodities.
- Use sidebar tools to filter and search for certain commodities or locations.
Table
- Displays raw data which can be filtered by a range of dates, specific locations, or specific locations.
Notes
- Prices are in Indian Rupee per kilogram of commodity.
- Prices have been averaged over month wherever possible. Unfortunately, the granularity of the data is inconsistent across locations. Thus, daily fluctuations may not be visible.
Data Source #1 | Data Source #2